Compiling and debugging C programs in UN*X
Objectives
-
Learn basic UN*X shell commands.
-
Learn how to compile and execute C programs on the lab machines (Linux environment).
-
Hands-on experience in debugging C programs.
Installation and configuration
For the lab work in this course, it is suggested to perform the following setup/configuration on your windows PC (macOS owners can skip these steps but need to install Xcode on their machines):
-
Start by downloading VirtualBox from the link provided in the “Resources | Additional Resources” of this site.
-
Still from the same VirtualBox page, download and install the “Extension Pack” corresponding to the version of VirtualBox that you have just installed on your machine.
-
Next, download and install the virtual machine (VM) “cvlab.ova” (1.7 GB) from the link provided (from the same section mentioned in step 1.). To add the VM to VirtualBox, follow the instructions given here.
-
It’s over! You now have a virtual machine with a setup similar to the machines in the lab rooms.
-
If your computer has 4 GB of memory or more, it is best to adjust the VM parameters and assign more memory to it.
-
Once you launch the VM, the system is configured to use a US keyboard
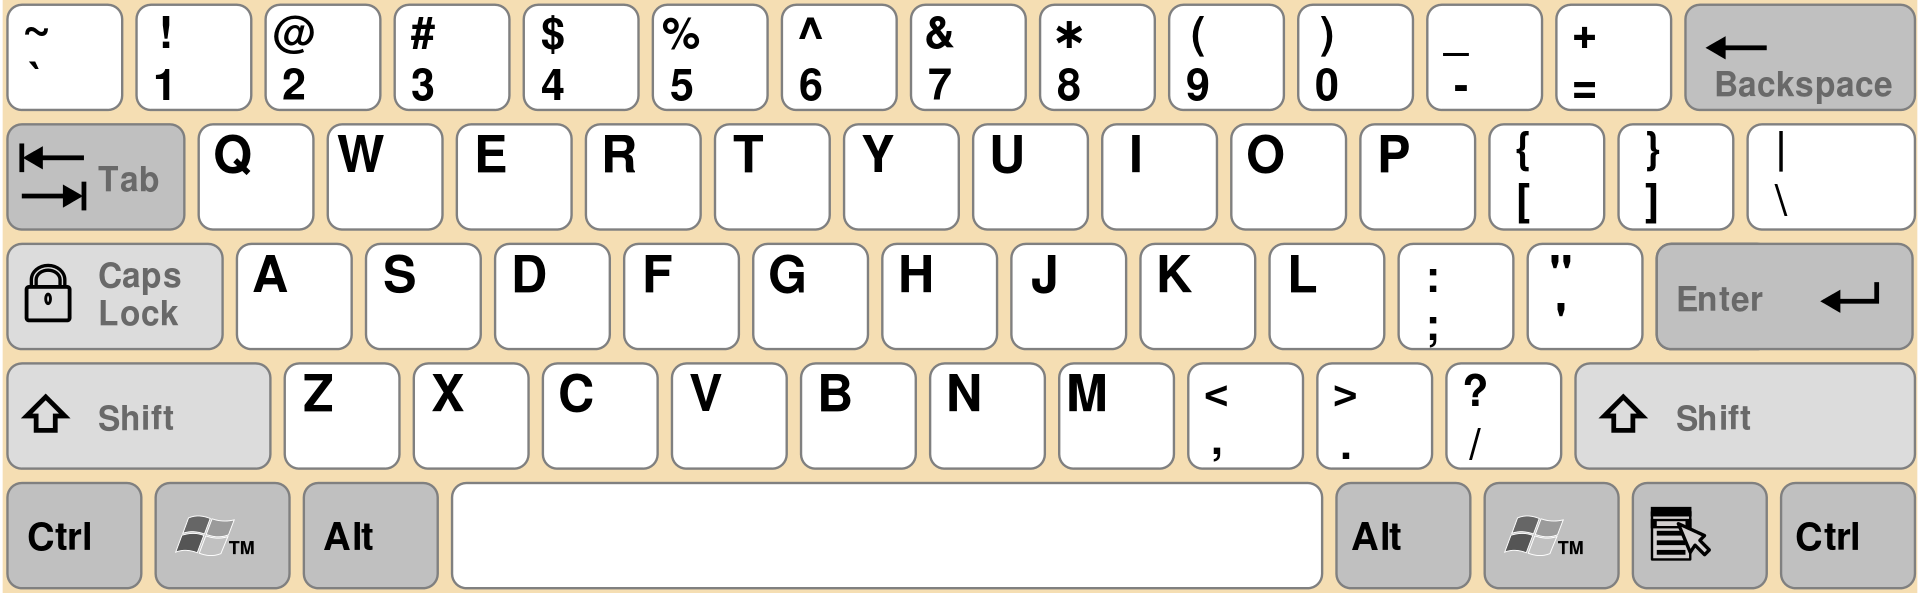 by default (as is the case with the lab machines). You can switch to a French keyboard
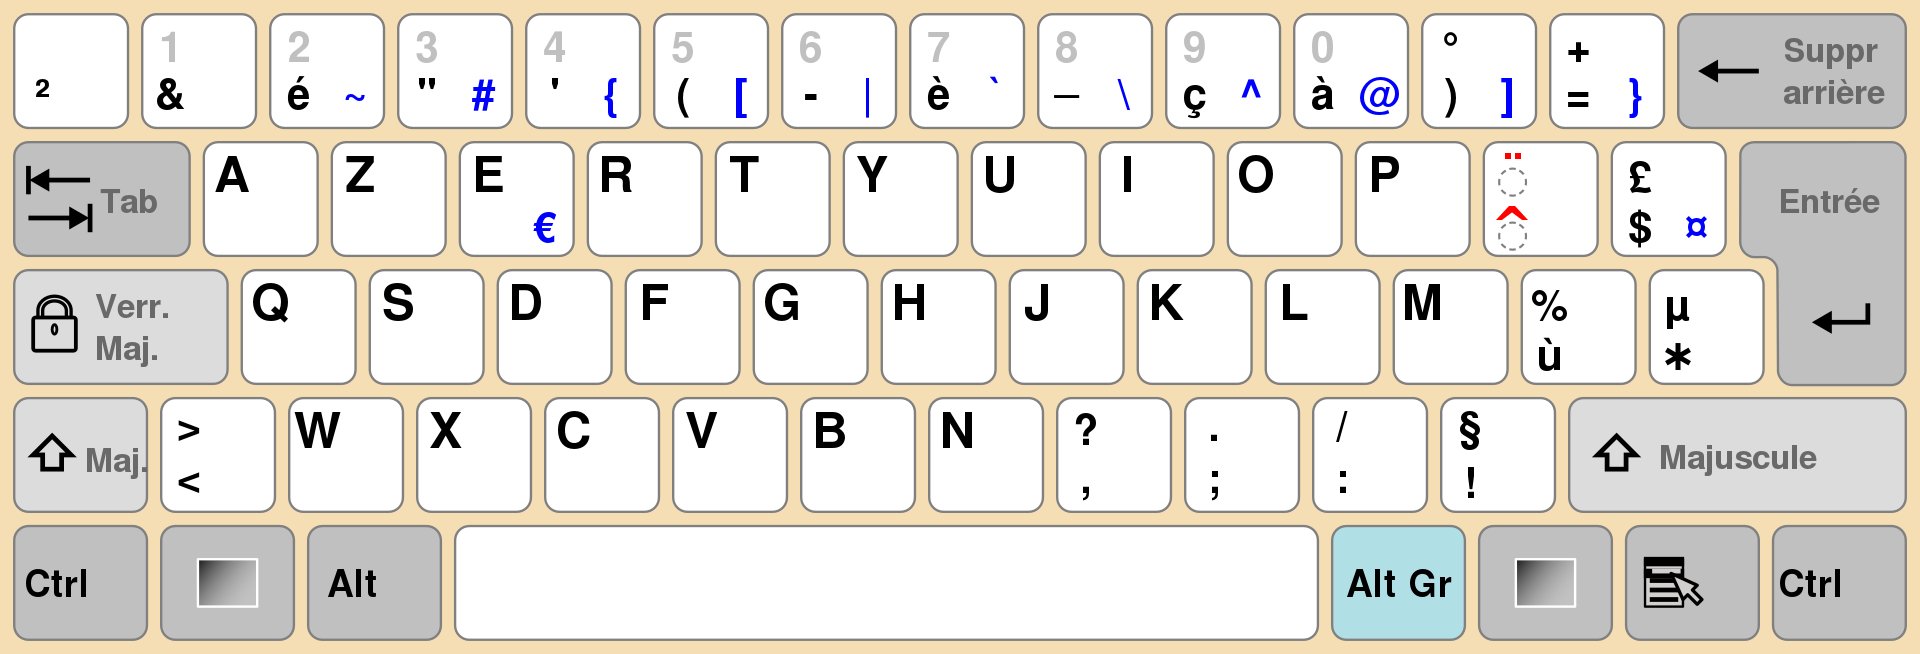 by clicking with the mouse on the American flag at the top right of the screen (it will switch to the French flag).
Note: You are free to install/configure your own PCs in any way that suits you. However, to complete the labs and homeworks in this course without too much difficulty and avoid problems/excuses/frustrations like “why does it work on my PC but not on the lab machines?” “, you are strongly encouraged to install the provided VM by following the instructions given above.
Exercise 1: (Shell UN*X)
In order to gain a minimum of experience with the Command Line Interface (CLI) under UN*X, we begin by introducing here some common commands that may be useful to you during this course. For an ‘advanced’ introduction to basic UN*X commands, see this tutorial (in french) and/or this tutorial.
The sample commands will be displayed as follows:
$ echo "Hello world"
Entering the above statement (without the $) into a “Terminal” (press Ctrl+Alt+T to open a Terminal window in Ubuntu) will execute the command. Here the instruction simply displays the message “Hello world” (without the quotes).
Flags are used to specify options for the command to execute or modify its behaviour. They usually start with one or two dashes and may take an additional argument.
$gcc --help
$ echo -e "Hello\nworld"
Keyboard shortcuts
When entering commands in a UN*X terminal:
-
The Tab key will automatically complete the current term (see this link for the layout of the keys in a keyboard).
-
The ↑ and ↓ keys will allow you to reuse commands you typed previously without re-entering them.
-
The combination Ctrl +
awill move the cursor to the start of the current line (useful for correcting errors). -
The combination Ctrl +
ewill move the cursor to the end of the current line (also useful for correcting errors) -
The combination Ctrl +
rwill allow you to search for ‘words/expressions’ in the recently used command.
File handling
The touch command creates an empty file with the file name provided as an argument.
$touch example.txt
This will create an empty file named “example.txt”. If you want to create a non-empty file (i.e. with content), you can use the command
$ echo "Your content between quotes" > example.txt
The above command will create a file with the name “example.txt” in the current directory. If the file already exists then it will be overwritten. The (new) file will contain the text “Your content in quotes” but without the quotes.
The > symbol is followed by an argument to redirect the output of the echo command that is normally passed to stdout (i.e. the screen) to a file (here “example.txt”).
You can also use the echo command without redirection. In this case, it will simply display the character string on the terminal (without creating a file).
$ echo "Hello world"
To view the contents of a file, you can use the cat or less commands.
$cat example.txt
$less example.txt
The cat command displays the content of example.txt on your terminal. less launches a very basic editor. You can give cat or less a relative or absolute path as an argument to display the content of ‘non-local’ files.
man - Manual pages
Man pages are excellent UN*X resources that are often underutilized; although not as versatile as Google, they contain documentation on UN*X commands, language standards and conventions, etc. They also work offline and can therefore be very useful if you are stuck without internet (because the underwater cable has been broken for the umpteenth time or during the baccalaureate exam period!).
Although your favorite search engine will probably have the answers you are looking for, in this course we would like you to become familiar with the use of the “man” command, particularly for questions relating to the C language and UN*X operating system.
To display the man page for a specific command (here the echo command is given as an example), one can execute the instruction:
$man echo | less
The man page for a command usually contains information about it, the meaning and effect of certain additional parameters when you invoke the command with them, and where to go for more information.
In the example above, we have redirected, using the pipe “|” symbol, the content of the user manual for the echo command to the less program. This allows us to scroll down the man page with the arrow keys or spacebar. Press the q key to exit the man page and return to your terminal prompt.
If you want to search the man pages for a command related to a specific keyword:
$ man -k specific_keyword | less
This command will search the man pages for all commands with the keyword specific_keyword.
Vim - the basics
Vim is a text editor included in many UN*X distributions.
Note: We’re using Vim here as an introduction to command-line text editors, but we have no strict requirements on which text editor you should use; you can choose any text editor that suits you (i.e. graphical or command line)! However, we would like to remind that, as a future computer scientist, you should know how to use at least one console text editor. If you don’t like Vim, you can try nano or emacs!
To open a file from your current directory, give Vim the file name:
$ vim filename
To open a file from another directory, use a relative or absolute path:
$ vim ../other_folder/filename
Some useful commands for Vim:
| Command | Meaning |
|---|---|
Esc:q |
Close (exit) Vim without saving |
Esc:wq
|
Exit Vim after saving changes |
Esc:w
|
Save the file |
Esc:q!
|
Force exit Vim without saving (when you have made changes but don’t want to keep them) |
Esci
|
“Insert” mode, allows you to edit the file |
Esc/cats |
Search the file for the first occurrence of the character string “cats”. Press n to go to the next occurrence or N to return to the previous one |
Esc:setnu
|
Show line numbers in your file |
Note: These commands are preceded by Esc to indicate that you must press the Escape key on your keyboard to exit the current mode. For example, if you want to save your file after editing, you must press the escape key to exit the “insert” mode, then type “:w” to save the file.
Exercise 2: (gdb)
A debugger, as the name suggests, is a program specifically designed to help you find bugs, or logical errors and mistakes in your program (note: if you want to know why errors are called “bugs”, see this answer). Different debuggers have different capabilities, but they all do the following:
-
Define a “breakpoint” in the program. A “breakpoint” is a ‘marked’ line in your code where you want to stop program execution so that you can examine what is happening in that region of the code.
-
Run the program step by step. Programs execute instruction by instruction, but this happens too quickly for us to ‘see’ which instructions or parts of the code are causing problems. Being able to ‘slow’ the execution of your code step by step allows you to see exactly what is happening with your code (and causing a bug in your program).
For this exercise, the GDB reference document will be very useful to you. GDB stands for “GNU De-Bugger”. First, download the starter file for this lab (from the top of this document) and unzip its contents with the unzip command (this command is already installed on the VM or lab machines) in the directory of your choice. Then compile the hello.c file with the -g flag (provide the full path of the hello.c file if different from the current directory):
$ gcc -g -o exe hello.c
The command above instructs the C compiler (i.e. gcc) to store additional information in the executable program so that the gdb/cgdb tool can correctly interpret your compiled program. Now run the cgdb debugger giving the path of the executable to debug as a parameter:
$ cgdb exe
The above instruction launches the cgdb program on the exe executable file generated by gcc. Don’t try to run cgdb on the hello.c source code, it won’t know what to do with it! If cgdb doesn’t work for you, try with gdb (i.e. run the gdb exe command). The cgdb debugger is installed by default on the VM/lab machines.
Note: If you are not using the provided VM, you can install gdb / cgdb on your computer, but be aware that it cannot be installed on (updated) macOS machines. If this applies to you you can use lldb which is another great debugger. The commands differ slightly from gdb, but there are excellent guides (like this one!) to get started. For this lab, however, use one of the machines in your lab room (or the VM) and cgdb.
Tasks to carry out:
Browse the hello program by doing the following:
-
set a breakpoint on the
mainfunction -
use the
runcommand fromgdb -
use the
gdbstep-by-step command
Type help from gdb for commands to perform these operations or use the GDB reference document.
If you see an error message like “printf.c: No such file or directory”, you probably entered a printf function! If you continue the execution step by step, you will feel like you are going nowhere! CGDB is complaining because you don’t have the source file where printf is defined. To break this deadlock, use the finish command to run the program until the undefined function returns (in this case, until printf has finished). To avoid this kind of mishap NEXT time, use the next command to skip the line where printf is displayed.
Note: cgdb vs. gdb
In this exercise, we use cgdb to debug our programs. cgdb is the same as gdb, except that it provides additional features that make it nicer to use in practice. All commands in the “GDB reference document” work with gdb.
In cgdb you can press escape to go to the code window (top) and i to return to the command window (bottom) - similar to Vim. The command window is where you will enter your gdb commands.
Tasks to carry out:
Knowing the answers to the questions below will be very useful to you for the rest of this lab and for your IT career in general:
-
When you are in a
cgdb/gdbsession, how do you define the arguments that will be passed to the program when it runs? -
How do you create a “breakpoint” in a program?
-
How to execute the next line of code after stopping at a “breakpoint”?
-
If the line of code to be executed is a function call then you will execute the entire function in one go if you use your answer to question #3 (Alternatively, consider a different command for question #3!). How do you tell GDB that you want to debug the code inside the function (i.e. enter the function)? (If you changed your answer to question #3 then the previous answer probably applies here.)
-
How to continue execution of the program after it has been suspended at a “breakpoint”?
-
How to print the value of a variable (or even an expression like 1 + 2) in
gdb? -
How to configure
gdbso that it displays the value of a variable after each execution step? -
How to display a list of all variables and their values in the currently executing function?
-
How to exit gdb?
Exercise 3: (Valgrind)
Even with a debugger we may not be able to catch all the bugs! Some bugs are what we call “bohrbugs”, meaning that they reliably manifest themselves under a set of well-defined, but perhaps unknown, conditions. Other bugs are what we call “heisenbugs”, and instead of being determinative, they are known to disappear or change their behavior when we try to study them. We can detect the first type with debuggers, but the second type can fly under our radar because they are often due (at least in the C language) to poorly managed memory.
Remember that, unlike other programming languages, C expects you (the programmer) to manage memory correctly. To detect and catch these “heisenbugs”, we will use a tool called Valgrind. This tool is a program that emulates your processor and lists all your memory accesses. This significantly slows down the program you are running (because of the emulation) but helps in detecting bugs that may otherwise go unnoticed.
Note: Valgrind is already installed on the VM/lab machines. This tool is also available on most UN*X distributions as well as on macOS. We recommend, however, that you use the VM or the lab machines to avoid possible compatibility issues. The GDB and Valgrind tools will become incredibly useful to you as you advance in your Computer Science career.
In this exercise, we will demonstrate two examples of using Valgrind and explain how they can be useful.
Using the gcc compiler, build two executables:
-
segfault_exfromsegfault_ex.c, and -
no_segfault_exfromno_segfault_ex.c.
Use the -o flag for executable names! Then try running the compiled programs…
$ ./segfault_ex
$ ./no_segfault_ex
What do you observe? Let’s start with segfault_ex. You should have observed a segmentation fault, which occurs when a program crashes after trying to access memory that is not his (we will talk about this later in the course). The source code segfault_ex.c is quite simple, you should be able to easily “understand” what is causing the segfault. Do not edit the file, there is no need to fix the error here.
Finding a “segmentation fault” in a very large file won’t be an easy task, and that’s where Valgrind comes in. To run the segfault_ex program in Valgrind, use the command:
$ valgrind ./segfault_ex
This should cause Valgrind to display where the “illegal access” occurred. Compare these results to what you determined by manually examining the segfault_ex.c file. How could Valgrind help you identify a segfault in the future?
Now try running Valgrind on no_segfault_ex. The program should not crash but there is still a problem with the file. Valgrind can help us find the (seemingly invisible) problem.
Unfortunately, you’ll see here that Valgrind doesn’t seem to be able to tell you exactly where the problem is occurring. Use the message provided by Valgrind to determine which variable has undefined behavior, then try to deduce what must have happened (Hint: what is an uninitialized value?).
At this point, we do not expect you to be familiar with the use of the sizeof keyword in the C language. But you can, nonetheless, build some intuition around where the problem has probably occurred.
Tasks to carry out:
After going through this exercise, you should be able to understand and answer the following:
-
Why Valgrind is an important and very useful tool?
-
How to run a program in Valgrind?
-
How to interpret error messages?
-
Why could uninitialized variables cause “heisenbugs”?
Exercise 4 (Makefile)
Manually compiling C programs in the terminal is a tedious and time-consuming operation that requires running multiple commands with long strings of arguments. While this is acceptable for compiling small C programs, things quickly become unmanageable when it comes to compiling programs with dozens of files and dependencies.
This is why most C programmers write what is called a “Makefile” to make it easier to compile and run programs. A Makefile is a text file (literally called Makefile) and contains a set of rules. Each of these rules specifies commands to execute to manipulate a program (eg: compile a source file, delete the executable, etc.). Once the “Makefile” is prepared, we only need to type the ‘make’ instruction in the command console to perform the tasks indicated in the “Makefile”.
$ #1) to compile then run the hello program
$ make hello
$ ./hello

$ #2) to compile all programs
$ make

$ #3) to run Valgrind on the already compiled segfault_ex program
$ make segfault_ex-memcheck
Consult the “Makefile” included in this lab startup files and try answering the following questions (correct answers can be viewed by clicking on the character ▸ to the left of each question). To learn more about Makefiles, Google is your friend ![]() .
.